Population Stability Index(PSI) and Characteristic Stability Index(CSI) in Machine Learning
During the model building and monitoring phases PSI and CSI can be a very powerful metrics. In this article we will try to cover when can we use them and how to use them. Before going into their use, I will try and explain what both PSI and CSI are.
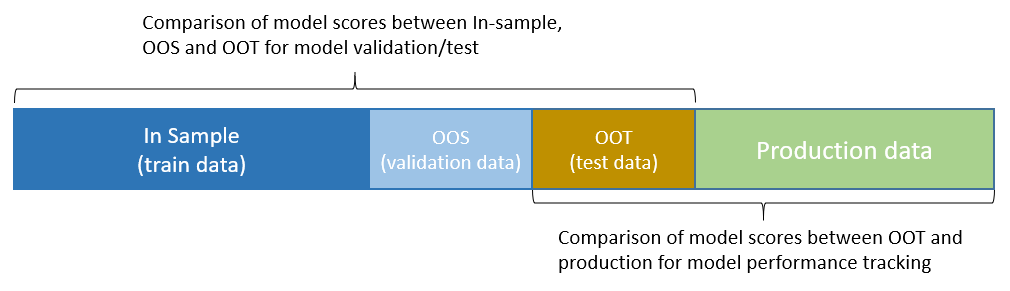
Population Stability Index (PSI): As the name suggests, it looks at the shift of the distribution of a variable across different time internals. Here the focus is only on the dependent variable. For model testing purpose we would compare the In-sample scores (got by scoring the model on the In-sample data or train data) with the Out-of-Time(OOT or test) scores. And for model tracking we would compare the original OOT scores with the new incoming scores from production environment.
In case we have a Out-of-Sample(OOS) or validation population we would compare the OOS scores with the In-sample scores too.
Characteristic Stability Index (CSI): It is the measure of the change in distribution of the independent variables over time. It can be used both for testing and performance tracking in a similar way to PSI, the comparison would be the distribution of variables unlike PSI where it is the model scores.
Steps involved in calculation of PSI:
Step 1: Decide on which population to use for reference, during testing In-sample will be the reference population and during performance tracking OOT population can be used as reference. (for simplicity sake we will use model testing as our use case)
Step 2: Rank order the reference scores and then divide them into ten deciles (10 bins of equal size). In case of categorical variables instead of creating bins you can keep them as is, or combine some categories if there are more than 10.
Step 3: Get the cutoff point used by you to create the reference bins.
Step 4: Calculate the number of records and % of records in each of the reference bins. They would ideally be same as (i.e. 10%) as we have created the bins of equal sizes. Only in case of some scores occurring very often, or categorical values the bins would be unequal in size.
Step 5: Apply the cutoff points, used to create the bins for In-sample, to the testing scores(OOT) (and production scores in case of performance tracking). This will help you get the bins for them.
Step 6: Calculate the number of records and % of record in the testing scores.
Step 7: Using reference as actual and testing as expected. Calculate the Index for each of the bins using the formula below:

The formula above had 2 parts which are multiplied with one another.
One is calculated by taking the difference of the values in Step 4 and Step 6. Another is calculated by taking the natural log of the division of the values in Step 4 and Step 6.
Step 8: Sum the Index for all the bins to get the PSI
Below Table Illustrating the same:

Steps involved in calculation of CSI:
All the steps are similar to PSI. Only difference being we would do it for the independent variables. Each and every independent variable would be considered one at a time and then CSI would be calculated for all of them. If we are using 100 variables in our model we would have 100 CSIs.
Understanding of PSI and CSI Values
The following is the rule of thumb for determining to what extent a variable has shifted in distribution:
< 0.1 : Very slight or no change. No action required
0.1 to 0.2 : Slight change. Frequent monitoring required.
> 0.2 : Significant change. Need for model redevelopment or variable removal from the model in case of CSI.
These thresholds were taken from the paper mentioned in reference. Although in many cases values >0.25 are considered as significant change. This would depend on the domain of application and based on it one could choose.
Application of PSI and CSI Values
- Model building purpose.
- Variable selection. CSI can be used for selecting only the less volatile variables, to make the model more stable over time.
- Model performance tracking.
CSI and PSI are simple to look at metrics that can provide a lot of information. During the exploratory phases of model development we look at the distributions, basic stats and infer things based on looking at a lot of combinations. CSI and PSI could be used to make things simpler and initial analysis faster. On top of they they also show if rework on the model is needed while it is running in production. And also, pointing out which independent variables are actually causing the shift in the distribution of the scores predicted.
References:
